A Method for Attributing Patient-Level Metrics to Rotating Providers in an Inpatient Setting


BACKGROUND: Individual provider performance drives group metrics, and increasingly, individual providers are held accountable for these metrics. However, appropriate attribution can be challenging, particularly when multiple providers care for a single patient.
OBJECTIVE: We sought to develop and operationalize individual provider scorecards that fairly attribute patient-level metrics, such as length of stay and patient satisfaction, to individual hospitalists involved in each patient’s care.
DESIGN: Using patients cared for by hospitalists from July 2010 through June 2014, we linked billing data across each hospitalization to assign “ownership” of patient care based on the type, timing, and number of charges associated with each hospitalization (referred to as “provider day weighted”). These metrics were presented to providers via a dashboard that was updated quarterly with their performance (relative to their peers). For the purposes of this article, we compared the method we used to the traditional method of attribution, in which an entire hospitalization is attributed to 1 provider, based on the attending of record as labeled in the administrative data.
RESULTS: Provider performance in the 2 methods was concordant 56% to 75% of the time for top half versus bottom half performance (which would be expected to occur by chance 50% of the time). While provider percentile differences between the 2 methods were modest for most providers, there were some providers for whom the methods yielded dramatically different results for 1 or more metrics.
CONCLUSION: We found potentially meaningful discrepancies in how well providers scored (relative to their peers) based on the method used for attribution. We demonstrate that it is possible to generate meaningful provider-level metrics from administrative data by using billing data even when multiple providers care for 1 patient over the course of a hospitalization.
© 2017 Society of Hospital Medicine
Hospitalists’ performance is routinely evaluated by third-party payers, employers, and patients. As hospitalist programs mature, there is a need to develop processes to identify, internally measure, and report on individual and group performance. We know from Society of Hospital Medicine (SHM) data that a significant amount of hospitalists’ total compensation is at least partially based on performance. Often this is based at least in part on quality data. In 2006, SHM issued a white paper detailing the key elements of a successful performance monitoring and reporting process.1,2 Recommendations included the identification of meaningful operational and clinical performance metrics, and the ability to monitor and report both group and individual metrics was highlighted as an essential component. There is evidence that comparison of individual provider performance with that of their peers is a necessary element of successful provider dashboards.3 Additionally, regular feedback and a clear, visual presentation of the data are important components of successful provider feedback dashboards.3-6
Much of the literature regarding provider feedback dashboards has been based in the outpatient setting. The majority of these dashboards focus on the management of chronic illnesses (eg, diabetes and hypertension), rates of preventative care services (eg, colonoscopy or mammogram), or avoidance of unnecessary care (eg, antibiotics for sinusitis).4,5 Unlike in the outpatient setting, in which 1 provider often provides a majority of the care for a given episode of care, hospitalized patients are often cared for by multiple providers, challenging the appropriate attribution of patient-level metrics to specific providers. Under the standard approach, an entire hospitalization is attributed to 1 physician, generally the attending of record for the hospitalization, which may be the admitting provider or the discharging provider, depending on the approach used by the hospital. However, assigning responsibility for an entire hospitalization to a provider who may have only seen the patient for a small percentage of a hospitalization may jeopardize the validity of metrics. As provider metrics are increasingly being used for compensation, it is important to ensure that the method for attribution correctly identifies the providers caring for patients. To our knowledge there is no gold standard approach for attributing metrics to providers when patients are cared for by multiple providers, and the standard attending of record–based approach may lack face validity in many cases.
We aimed to develop and operationalize a system to more fairly attribute patient-level data to individual providers across a single hospitalization even when multiple providers cared for the patient. We then compared our methodology to the standard approach, in which the attending of record receives full attribution for each metric, to determine the difference on a provider level between the 2 models.
METHODS
Clinical Setting
The Johns Hopkins Hospital is a 1145-bed, tertiary-care hospital. Over the years of this project, the Johns Hopkins Hospitalist Program was an approximately 20-physician group providing care in a variety of settings, including a dedicated hospitalist floor, where this metrics program was initiated. Hospitalists in this setting work Monday through Friday, with 1 hospitalist and a moonlighter covering on the weekends. Admissions are performed by an admitter, and overnight care is provided by a nocturnist. Initially 17 beds, this unit expanded to 24 beds in June 2012. For the purposes of this article, we included all general medicine patients admitted to this floor between July 1, 2010, and June 30, 2014, who were cared for by hospitalists. During this period, all patients were inpatients; no patients were admitted under observation status. All of these patients were cared for by hospitalists without housestaff or advanced practitioners. Since 2014, the metrics program has been expanded to other hospitalist-run services in the hospital, but for simplicity, we have not presented these more recent data.
Individual Provider Metrics
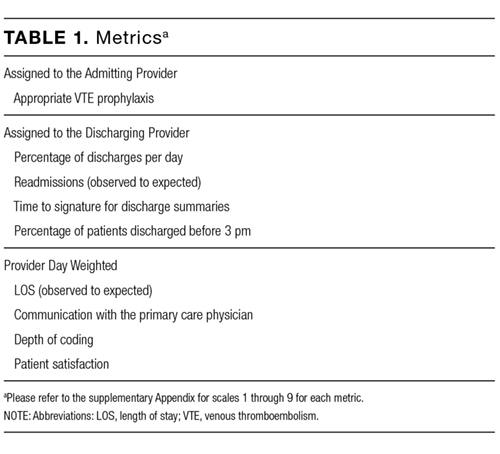
Metrics were chosen to reflect institutional quality and efficiency priorities. Our choice of metrics was restricted to those that (1) plausibly reflect provider performance, at least in part, and (2) could be accessed in electronic form (without any manual chart review). Whenever possible, we chose metrics with objective data. Additionally, because funding for this effort was provided by the hospital, we sought to ensure that enough of the metrics were related to cost to justify ongoing hospital support of the project. SAS 9.2 (SAS Institute Inc, Cary, NC) was used to calculate metric weights. Specific metrics included American College of Chest Physicians (ACCP)–compliant venous thromboembolism (VTE) prophylaxis,7 observed-to-expected length of stay (LOS) ratio, percentage of discharges per day, discharges before 3