A Computer-Assisted Process to Reduce Discharge of Emergency Department Patients with Abnormal Vital Signs


From Case Western Reserve University, MetroHealth Medical Center, Cleveland, OH.
Abstract
- Objective: To describe a computer-assisted process for reducing the number of patients discharged from the emergency department with abnormal vital signs.
- Methods: We devised a best practice alert in the Epic electronic medical record that triggers when the clinician attempts to print an after visit summary (discharge paperwork) at the time of discharge from the emergency department.
- Results: We saw no change in the percentage of patients discharged with elevated blood pressures, consistent with national recommendations. Removing that category of patients, we saw a decrease in the percentage of patients discharged with abnormal vital signs, primarily driven by a decrease in the percentage of patients discharged with tachycardia.
- Conclusion: A computer-assisted process can reduce the percentage of patients discharged with abnormal vital signs. Since based on national recommendations ED physicians do not address most elevated blood pressures in the ED, hypertension should not trigger an alert.
Abnormal vital signs in the emergency department (ED) have been associated with adverse outcomes [1,2]. While most patients discharged from the ED do well, some studies have found that the death rate within days to weeks post–ED discharge may be as high as 200 per 100,000 visits, although other studies have found a much lower rate [1]. A study by Sklar et al, although not specifically focused on vital signs at discharge, found that unexpected death within 7 days of ED discharge occurred at a rate of 30 per 100,000 patients. Abnormal vital signs, most commonly tachycardia, were present in 83% of cases [2].
In busy EDs, the combination of patient volume, frequent interruptions, and the intensity of tasks can result in deficiencies in vital sign monitoring [3–5] as well as abnormal vital signs not being recognized by the clinician at the time of patient discharge [6]. The importance of addressing this quality problem has been recognized. Prior efforts to address the problem have included nurses using manual methods to alert the physician to the presence of abnormal vital signs at the time of discharge [7]. Recommendations have been made to use electronic medical record (EMR) functions for prospectively addressing the problem of ED discharge with abnormal vital signs [8]. The utility of the EMR to identify potentially septic patients earlier and reduce mortality from sepsis via an algorithm that incorporated vital signs and other clinical crieria has been demonstrated [9,10]. In addition, automated vital signs advisories have been associated with increased survival on general hospital wards [11].
An adverse event that occurred at our institution prompted us to review this issue for our ED. We designed an EMR-assisted intervention to reduce the rate of patients discharged from the ED with abnormal vital signs.
Methods
Setting
Our ED is a busy, urban, Level 1 trauma center within a teaching facility. It sees over 100,000 patients per year and is segmented into resuscitation, high acuity, moderate acuity, and fast tract areas, in addition to the observation unit. Our organization uses the Epic (Madison, Wisconsin) electronic health record, which we have been using for over a decade.
Discharge Instructions—Old Process
In our ED, providers, attending physicians, residents and advance practice nurses enter and print their own discharge instructions, which are given to nursing staff to review with patients. Prior to the project, nurses were expected to notify a physician if they thought a vital sign was abnormal. Each nurse made independent decisions on what constituted a vital sign abnormality based on the patient’s condition and could communicate that to the provider at their discretion prior to discharge. This process created inconsistencies in care.

Development of Alert
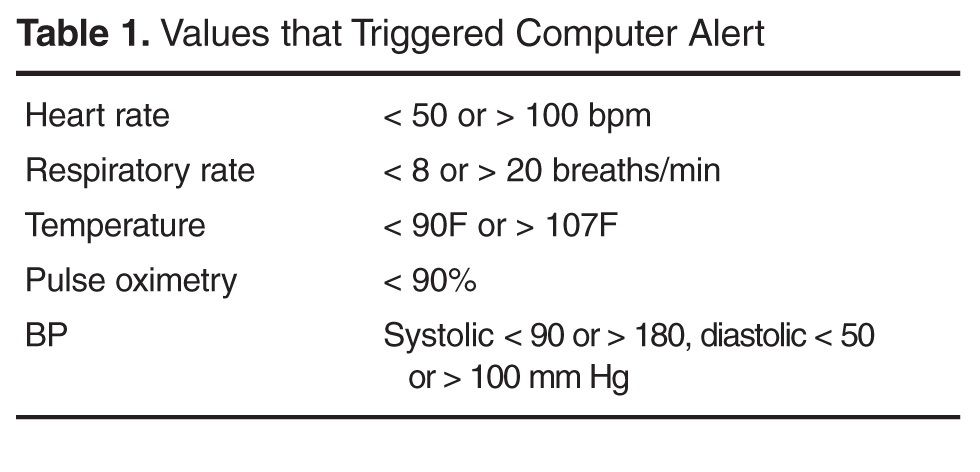
We created an alert that appears within the provider workflow at the time the provider attempts to print discharge instructions. Based on literature review and operational leadership consensus, we set the parameters for abnormal vital signs (Table 1). We chose parameters to identify abnormalities important to 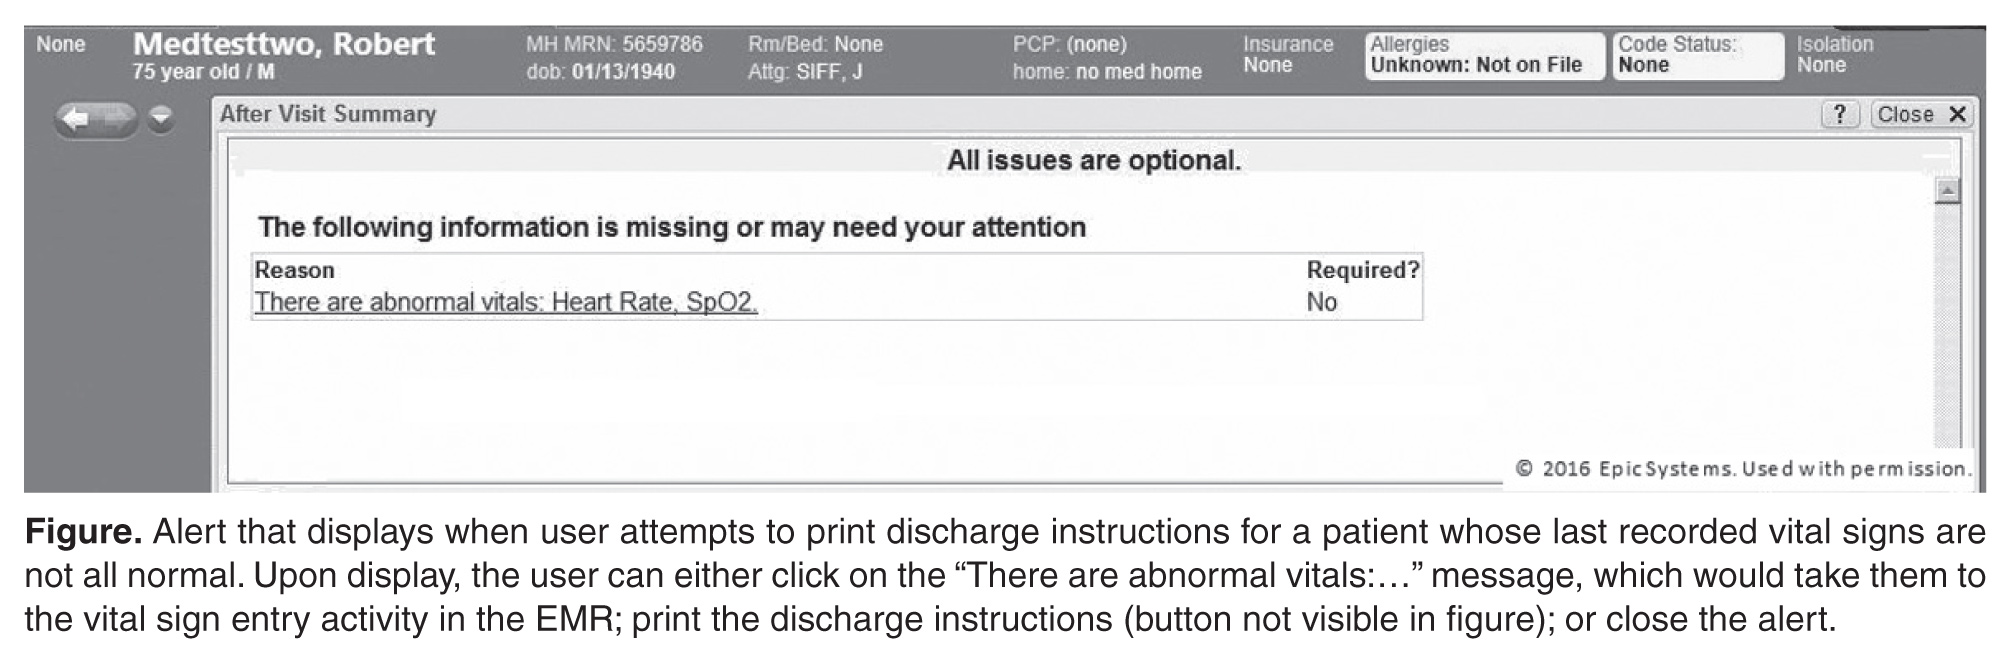
The alert displays when a user attempts to print discharge instructions on a patient whose last recorded vital signs are not all normal. The display informs that there are abnormal vital signs (Figure). Upon display of the alert, the user can click on the message, which would take them to the vital sign entry activity in the EMR, or they can proceed with printing by clicking the print button (not visible in the Figure). The alert is not a forcing function; the user can proceed with printing the discharge instructions without addressing the abnormality that triggered the alert.
Pre-Post Evaluation
We would have liked to have determined how often the abnormal vital signs alert triggered, how it was responded to, and whether the patient was subsequently discharged with normal vital signs; however, our system does not record these events. Instead, we used the system to compare the percentage of adult patients who were discharged with abnormal vital signs for 2 time periods: the period prior to our December 2014 implementation (1 Oct to 1 Dec 2014) and the post implementation period (15 Dec 2014 to 15 Feb 2015). Our presumption was that the use of the alert system would reduce the percentage of patients discharged with abnormal vital signs, including an abnormal pulse oximetry.
To conduct our analysis, we identified adult patients seen during the 2 time periods. We eliminated those patients who died, left without being seen, eloped, were admitted or were transferred to other institutions. This resulted in 3664 patients, with 2179 in the pre-implementation group and 1485 in the post-implementation group. The higher volume in the pre group reflects the early occurrence of influenza season in our area during the study period, along with our generally busier time in late fall compared to winter.
The analysis was performed as a likelihood ratio chi-square analysis using SAS (Cary, NC) software.