Making Quality Real for Physicians


From the Department of Medicine Quality Program, Brigham and Women’s Hospital (Drs. Pennant, McElrath, Coblyn, and Desai) and the Institute for Relevant Clinical Data Analytics, Boston Children’s Hospital, (Drs. Szent-Gyorgyi and Greenberg), Boston, MA.
Abstract
- Objectives: To describe the department of medicine quality program (DOMQP) at Brigham and Women’s Hospital (BWH).
- Methods: The program began in 2007 to engage physicians in local, specialty-specific quality efforts. The program has broadened its scope to include government mandates and hospital-wide priorities, such as maintenance of certification (MOC), “meaningful use (MU),” and medication reconciliation. More recently, we have evolved into a project-based program focusing on both chronic disease management and optimizing care pathways for high-risk inpatient conditions. Our key strategies are developing metrics, raising awareness, distilling information to front-line staff, highlighting relevant action items, and bringing feedback from front-line staff to hospital leadership.
- Results: We have developed 21 metrics across 13 clinical divisions, with performance improvement seen in > 50% of metrics. In 2014, we leveraged our quality metrics to earn MOC credit, with 100 physicians across 10 divisions earning MOC points through the Practice Assessment option. Additionally, department physicians achieved 90% compliance with our institutional medication reconciliation policy. The percentage of physicians achieving stage 1 MU was 98% in 2013, 99% in 2014, and 100% achieved stage 2 MU in 2015.
- Conclusion: Over the past 10 years, the DOMQP has played a unique role in promoting quality and serves as a model for QI within the hospital. We are well positioned to provide support to physicians and their practices as the health care environment continues to evolve.
Key words: quality improvement; quality measurement.
Within the past several years, the health care landscape in the United States has shifted considerably. New financial risk and quality-related incentive structures have been put in place, such as financial incentives to adopt electronic health records (EHRs) and to demonstrate “meaningful use (MU)” of these EHRs [1]. There is greater focus on value based payments, and accountable care organizations (ACOs) are proliferating [2–4]. Certification and training requirements have changed and require completion of performance improvement projects [5,6]. Upcoming changes to quality measurement and improvement through the Quality Payment Program will bring further changes to how clinicians are both monitored and incentivized or penalized [7]. The confluence of these efforts provides an impetus to incorporate quality measurement and improvement into the day to day practice of medicine.
In 2007, the department of medicine (DOM) at Brigham and Women’s Hospital (BWH), a teaching affiliate of Harvard Medical School and a founding member of Partners Healthcare, began a quality program (DOMQP) to engage physicians in local, specialty-specific quality efforts [8]. The program began by focusing on internally developed performance metrics to drive physician engagement. Later, the program expanded its focus to include more externally focused mandates from federal government and other accreditation bodies [9,10]. In this article, we discuss our efforts, including our early stage work and more recent focus in the areas of meaningful use, medication reconciliation, and maintenance of certification as well as our ongoing projects focused on chronic disease management and high-risk inpatient conditions.
Setting
The DOM has approximately 1400 physician faculty members and is the largest clinical department at BWH. The DOMQP is comprised of a medical director (0.35 FTE) and 2 project coordinators (2 FTE) who operate in a consultative capacity to liaison between the various levels of clinical leadership and frontline staff. The DOMQP serves 13 divisions: 11 medical specialties, primary care, and the hospitalist service.
Internally Driven, Specialty-Specific Quality Metrics
The early stages of our efforts focused on engaging clinical leadership and physicians, navigating the hospital’s information systems (IS) to develop quality reports within the EHR and implementing strategies for improvement. Until 30 May 2015, BWH utilized an internally developed EHR comprising a myriad of individual systems (eg, billing, electronic medication administration, clinical repository) that did not interface easily with one another. To resolve the IS challenges, we engaged many levels of the organization’s IS structure and requested updates or developed workaround solutions leading to the integration of the various datasets for comprehensive reporting. This resulted in a new agreement between the hospital and Partners that allowed for billing data to be sent to the same repository that housed the clinical data.
We developed at least one data report for each specialty division. The divisions selected a quality measure, and we worked with clinical leadership to define the numerator and denominator and identify any additional information they wanted in the report, eg, demographics, visit dates, labs. To produce the report, an IS consultant compiles the data elements on an excel spreadsheet. This spreadsheet is then manually chart reviewed by the DOMQP for accuracy before it is converted into a report. The report is then reviewed by the DOMQP to ensure the information is presented correctly and is easily interpreted, and then shared with the division champion(s), who determine how to message and introduce a proposed improvement effort before it is shared with the entire division.

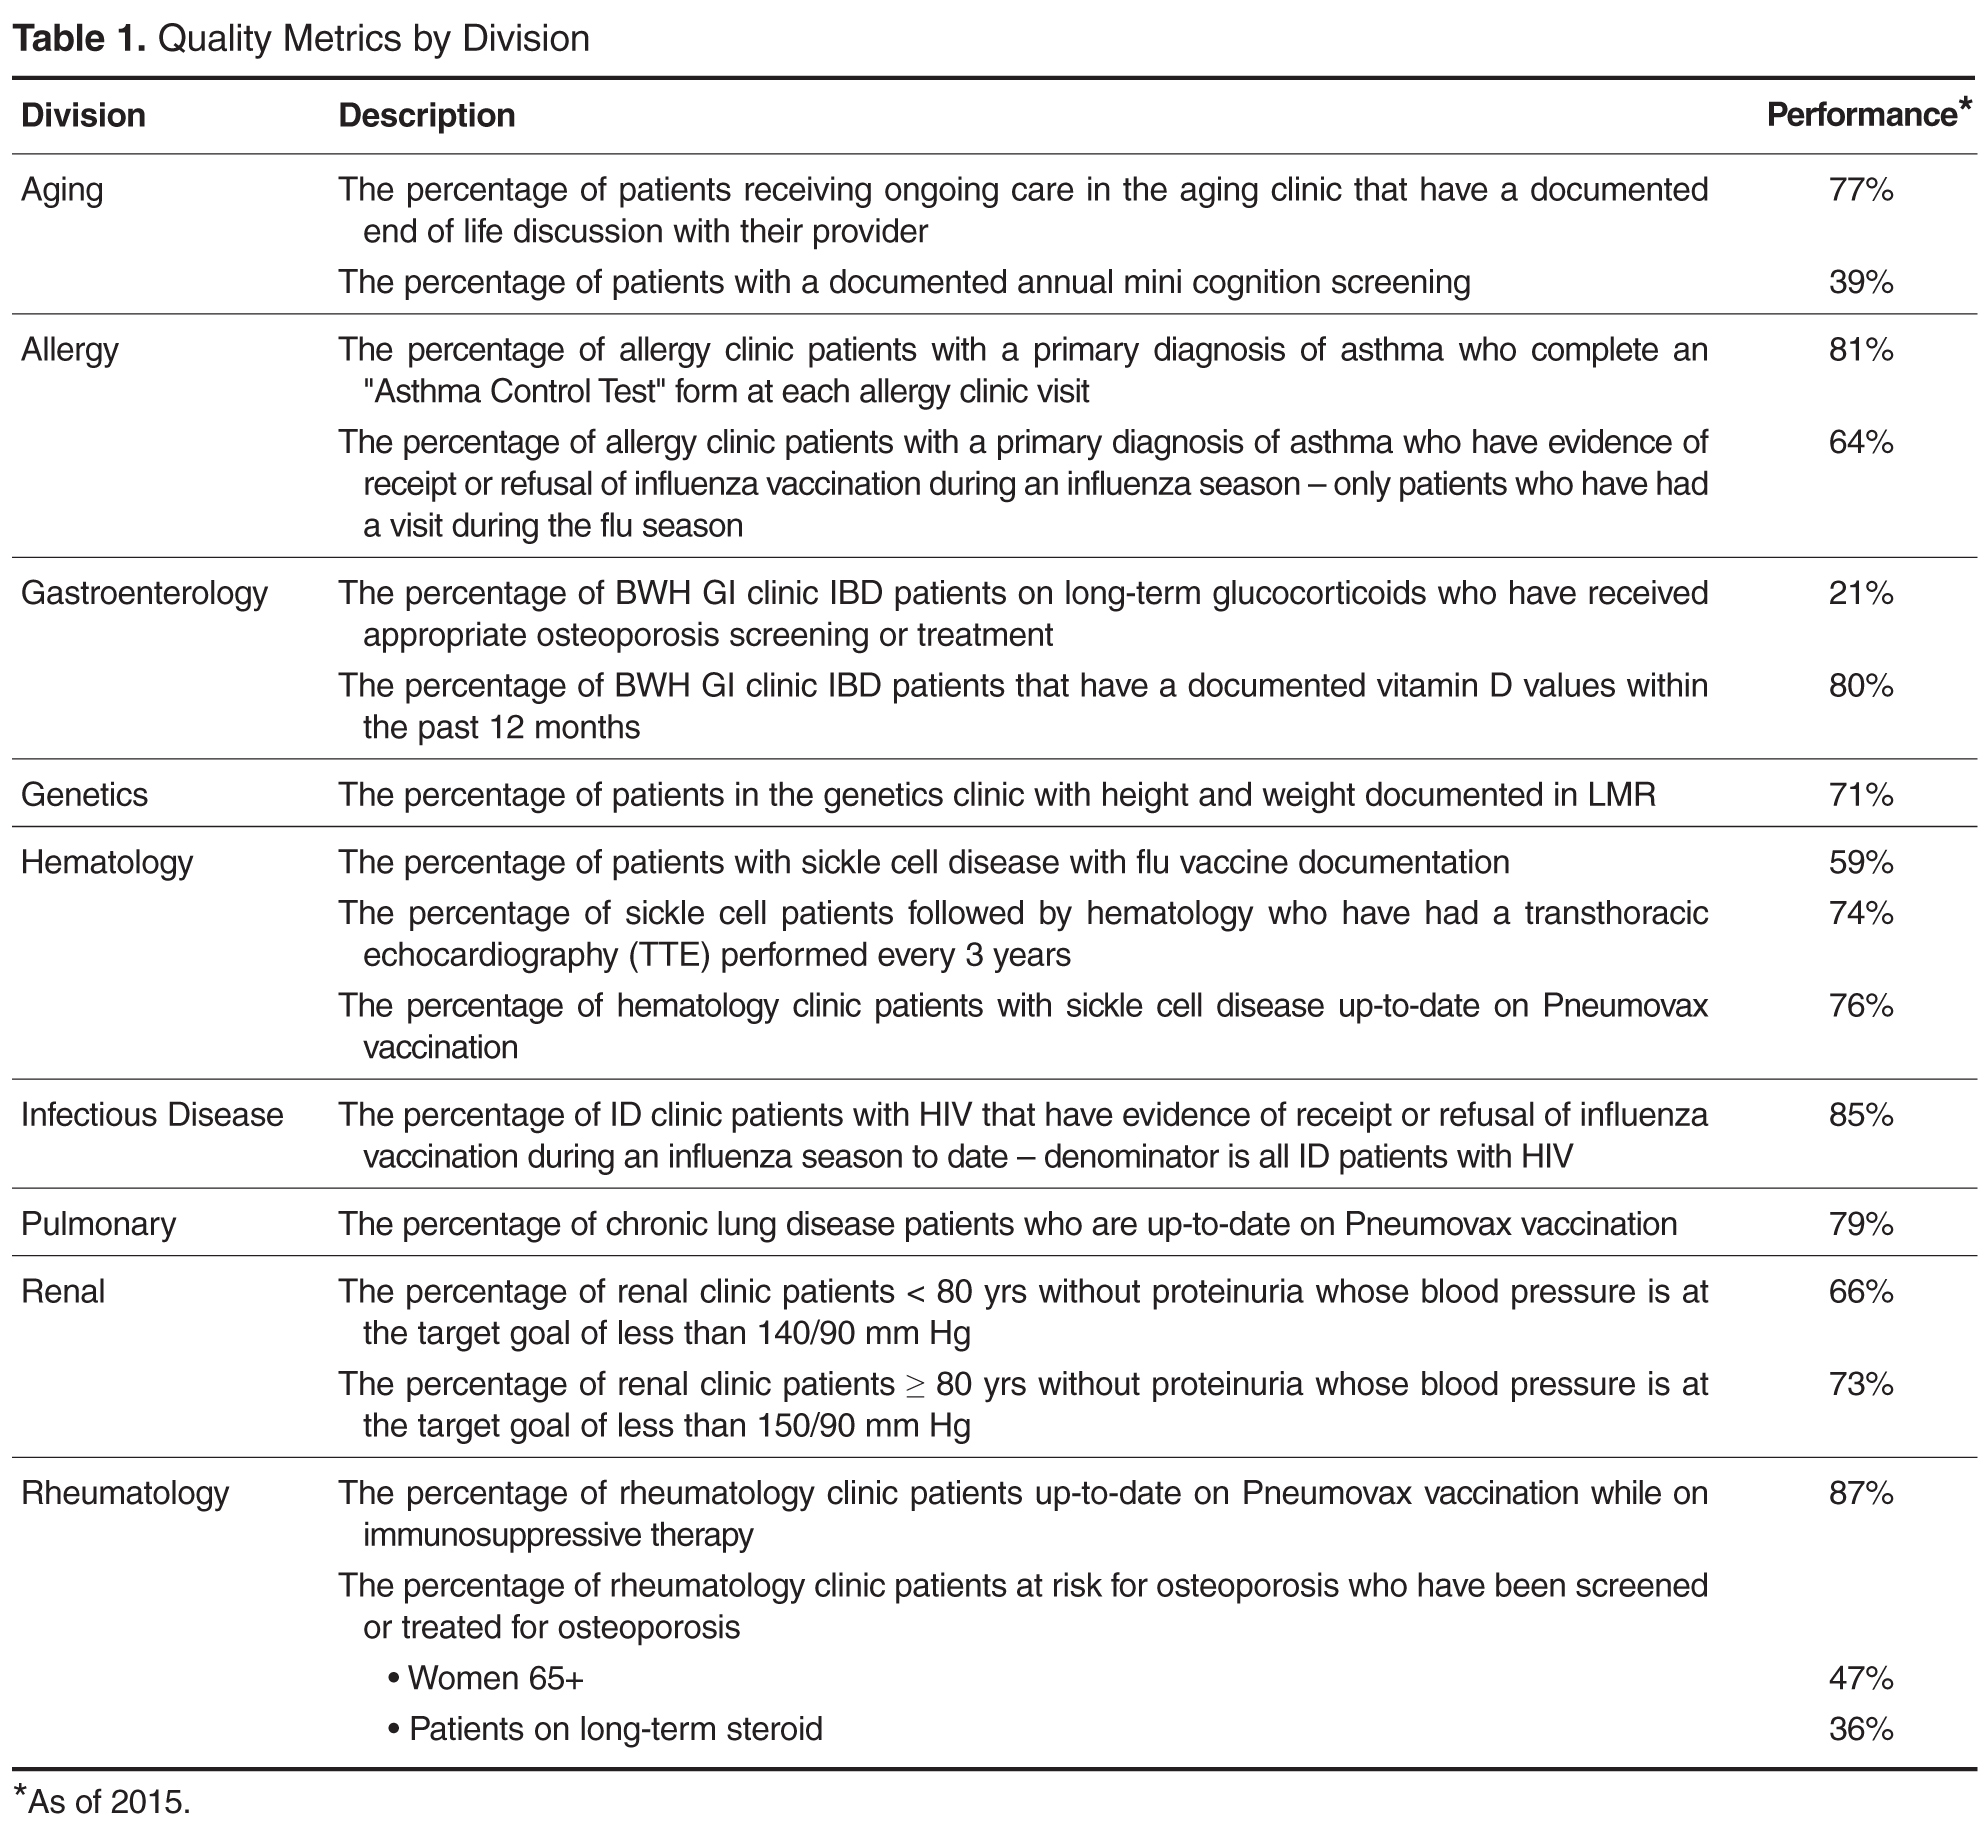
In an effort to improve influenza and pneumococcal vaccination rates, we worked closely with front-line clinicians and staff to create improvement strategies tailored to the patient population and clinic staffing structure in 4 divisions: allergy (order and document flu vaccinations for asthma patients), rheumatology (point-of-care standing pneumococcal paper-orders for immunosuppressed patients), infectious diseases (a nurse-driven influenza protocol was implemented for HIV patients), and pulmonary (letters sent to chronic lung disease patients asking them to bring documentation of prior pneumococcal vaccination to their next visit). We saw increases in vaccination rates across all 4 divisions using varied approaches to reach our goals [17].